Energy forecasting & intelligent management
Smart monitoring to forecast and optimise energy use in heritage buildings.
This service helps cultural heritage buildings to optimise energy performance by combining real-time monitoring, data analytics, and machine learning. Through a web-based platform, users can visualise energy consumption across different systems, identify inefficiencies, and forecast future energy needs to support smarter, more sustainable operations.
Key Features
-
Real-time energy monitoring
Track consumption across systems such as HVAC, lighting, and equipment.
-
Benchmark comparisons
Identify anomalies and periods of overconsumption through direct system comparisons.
-
Historical pattern analysis
Aggregate energy use trends by weekday, week, or month for deeper insights.
-
Machine learning forecasts
Generate short-term and weekly energy predictions using advanced algorithms.
-
Automatic anomaly detection
Flag irregular usage patterns to support timely interventions.
-
Data Driven Energy Management
Energy consumption is optimized based on thermal comfort optimization and peaks savings.
-
Scalable, modular design
Deploy easily across heritage sites and integrate with existing infrastructure.
Benefits
-
Detect irregular or high energy consumption periods through real time monitoring and patterns analytics
-
Supports data energy optimization through forecasts
-
Reduces CO₂ emissions while maintaining comfort and preservation standard
-
Turns raw consumption data into actionable knowledge
-
Anticipates energy demand to optimise building management strategies
-
Adapts to different building types, climates, and operational contexts
How it works
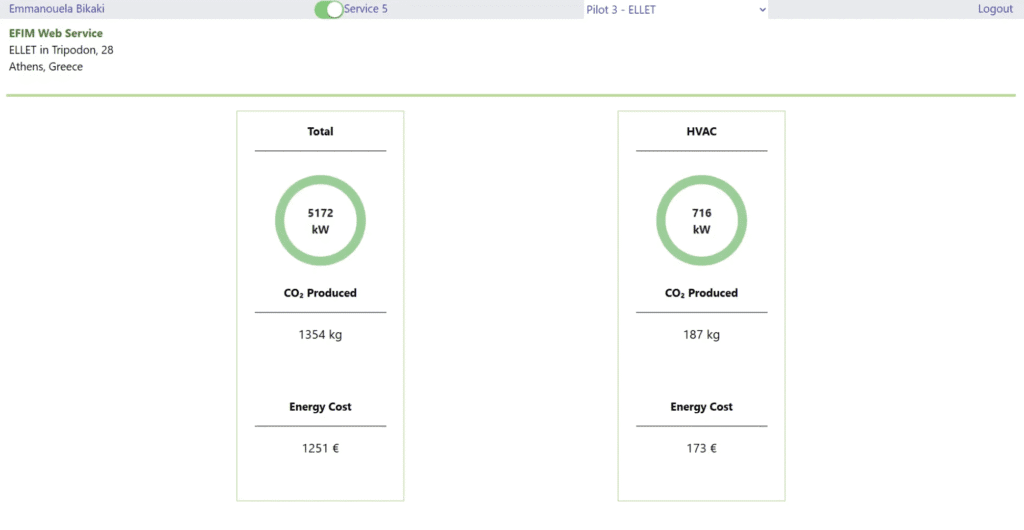
Sensors track consumption across building systems such as HVAC, lighting, and equipment. An anomaly detection algorithm identifies unusual patterns or deviations, while benchmark comparisons—such as usage differences from the previous day or other reference periods—help highlight inefficiencies or risks that could impact operational performance or heritage preservation. Users interact with the system through a structured web application featuring interactive dashboards that provide an overview of total and category-specific energy use, real-time readings, historical trends, and machine learning–based forecasts.
Colour-coded indicators, dynamic charts, and visual comparisons allow users to quickly identify irregular patterns, assess performance in context, and explore recurring inefficiencies over days, weeks, or months. Predictive models offer short-term and weekly forecasts, supporting proactive load management, planning of interventions, and optimisation strategies that balance energy savings with comfort and conservation requirements.
An upcoming module will further provide tailored recommendations for load shifting and efficiency improvements, estimating potential gains in cost, emissions, and performance. Built on a three-layer architecture with PostgreSQL for structured and traceable data, Python-based analytics for forecasting and anomaly detection, and a React interface for intuitive visualisation, the system is containerised with Docker for scalable deployment and integrates seamlessly with the Data Exchange Platform to consolidate real-time and historical data across pilot sites.